
How to Look Up Riverside County Jail Population Data
The Riverside County Sheriff's Office is the data owner for the five county jails. The Sheriff publishes a public safety review document that captures rated capacity, year built, gender housing, and medical or mental-health capability for every site. The Corrections Operations page at riversidesheriff.org/183 is the parent hub. Sheriff annual reports, when published, carry the most current operating numbers. National context lives at the Bureau of Justice Statistics at bjs.ojp.gov. County-level trend context comes from the Vera Institute at incarcerationtrends.vera.org.
Update cadence varies by source. The Sheriff's facility-level capacity figures change rarely. They shift only when a new building opens, a wing closes, or BSCC reissues a rated number. Average daily population, or ADP, moves day to day. BJS publishes a national jail census on an annual cycle. Vera maps county data on a multi-year cycle. A reader should read each figure with its source date in mind. A 2015 ADP slice in a Sheriff review is not the same as a 2024 county budget headcount.
A lead-in to the federal data source: view the Bureau of Justice Statistics jail population data page.
BJS data sets cover jail populations, demographics, admissions, and confined status across U.S. counties.
Riverside County Jail Capacity Overview
The Sheriff's public safety review records a Board of State and Community Corrections rated capacity of 3,629 beds across the five Riverside County jails. The table below lists each facility, its BSCC rated capacity, year built, and a short note about housing. Capacity is the planned, rated bed count. It is not the same as a real-time headcount. Some beds may be offline for repair, classification, medical use, or programming.
| Facility | Rated Capacity | Year Built | Notes |
|---|---|---|---|
| Blythe Jail | 79 | 1964 | Men only. Limited medical and mental-health staff. |
| John J. Benoit (Indio) | 238 | 1959 | Men and women. Medical staff yes, limited mental-health. |
| Larry D. Smith (Banning) | 1,458 | 1920 with later upgrades | Largest county jail. Full medical and mental-health. |
| Robert Presley (Riverside) | 760 | 1989 | Men and women. Full medical and mental-health. |
| Cois M. Byrd (Southwest) | 1,094 | 1993 | Men only. Full medical and mental-health. |
| Total | 3,629 | n/a | BSCC rated total across the system. |
Aggregate capacity can mask facility-level pressure. Blythe's 79 beds with limited medical and mental-health staff cannot stand in for a mental-health-capable bed at Presley or Smith. Women's housing exists only at Benoit, Smith, and Presley. Geography matters as well: Coachella Valley arrests feed Benoit, southwest Riverside County arrests feed Cois M. Byrd, and downtown arrests feed Presley.
Average Daily Population
Average daily population, often shortened to ADP, is the average inmate headcount across a fixed period. The Sheriff's public safety review carries a 2015 ADP visualization with category figures of 367, 845, 1,316, 209, 195, 491, 61, and 237 across violent crimes, property and drug crimes, Penal Code §§3056, 3455, and 3454 holds, all other, pretrial inmates, and sentenced inmates. The exact category-to-number mapping in that PDF is hard to recover cleanly, so the safer read is that the system runs near, at, or above its rated total in many windows. A current 2024 or 2026 county ADP figure was not located in the official Riverside sources reviewed.
Demographic Breakdown
Current detailed demographic data for the Riverside County jail population was not located in publicly indexed Sheriff sources during research. Statewide and national context can stand in until the Sheriff posts a refreshed breakdown. Riverside County total population sits at about 2.4 million per the county. The U.S. Census Bureau QuickFacts page for Riverside County is at census.gov.
A lead-in to the Census data: view the U.S. Census QuickFacts page for Riverside County.
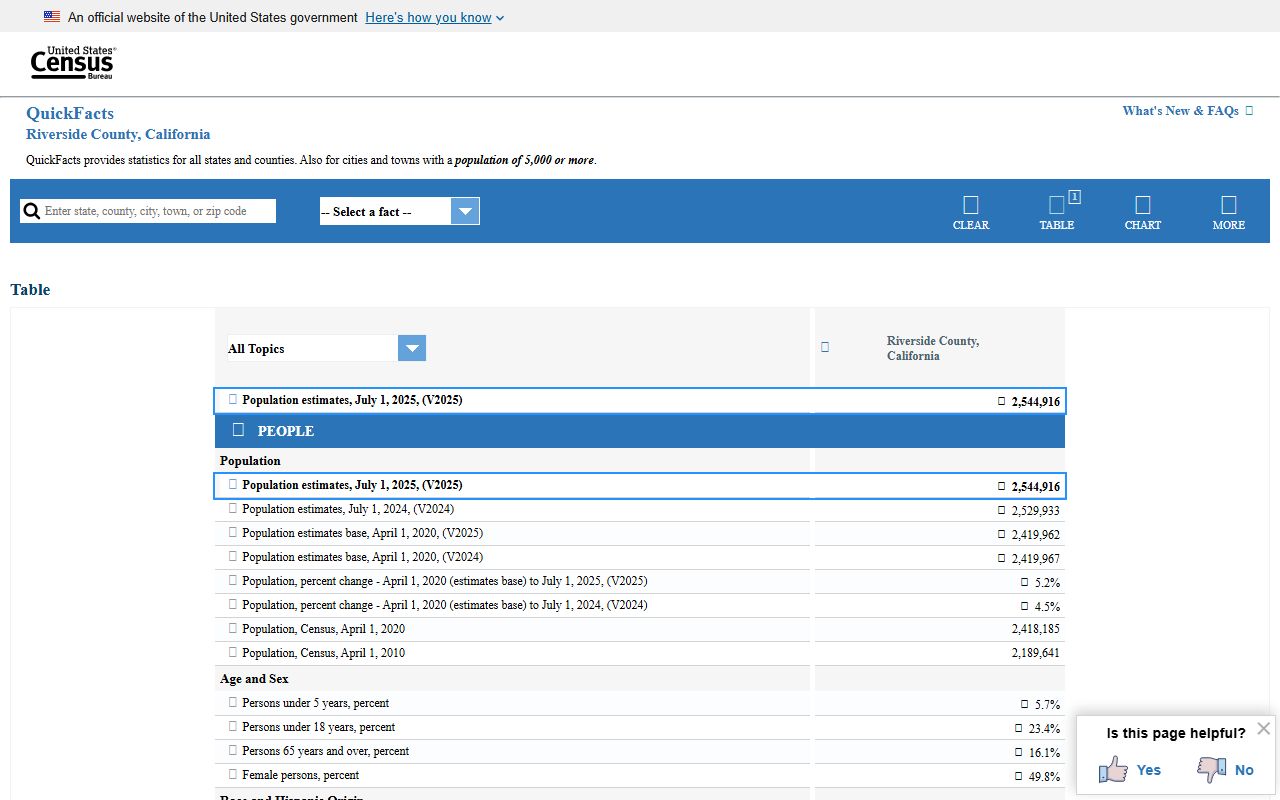
Census QuickFacts shows the county-level age, race, and household profile that gives the jail figures their denominator.
Pretrial vs Sentenced Population
The split between people awaiting trial and people serving a sentence shapes how a jail runs. Pretrial detainees move on court calendars. Sentenced inmates may be placed in programs like Supervised Electronic Confinement, Work Release, or Residential Substance Abuse Treatment at Larry D. Smith. The 2015 Sheriff review fragment shows that both categories were a meaningful share of system population at that time. Current pretrial and sentenced shares were not located in indexed Sheriff sources.
| Status | Share | Notes |
|---|---|---|
| Pretrial | Data not currently published | People held while a case moves through court. |
| Sentenced | Data not currently published | People serving a county jail term. |
| Programmatic | Subset of sentenced | Work release, electronic confinement, RSAT, SITE-B. |
National BJS data shows that roughly two-thirds of U.S. jail inmates are pretrial in a typical recent year. California county jails carry a similar mix, with some shift after the 2011 realignment under AB 109. That law moved certain felony sentences from state prison to county jails. Riverside felt that shift the same way other large counties did.
Misdemeanor vs Felony Population
Most people in the Riverside County jail are held on felony bookings. Misdemeanor bookings are usually shorter. Many misdemeanor arrests end with citation release or a same-day cite-out at the field stage. Realignment under AB 109 also kept some longer felony terms in county jail instead of moving them to state prison. The Sheriff's 2015 review categories of violent crime, property and drug crime, and Penal Code §§3056, 3455, and 3454 holds show that realignment population is a meaningful slice.
Mental Health and Medical Population
Three of the five jails report full medical and mental-health staffing: Larry D. Smith, Robert Presley, and Cois M. Byrd. John J. Benoit reports medical staff with limited mental-health staff. Blythe reports limited staffing on both. That uneven coverage means high-acuity mental-health cases tend to be placed at Smith or Presley. A jail housing decision can hinge on bed availability for a person in mental-health crisis. The Sheriff's PREA policy applies system-wide and is published on the Corrections Operations page.
National and State Context
National jail population trends come from the Bureau of Justice Statistics. BJS reports show that U.S. jails held about 663,100 people at midyear 2022. The national jail incarceration rate has hovered near 200 per 100,000 residents in recent BJS reports. California's state incarceration profile is summarized by the Prison Policy Initiative at prisonpolicy.org/profiles/CA.html.
A lead-in to the state profile: view the Prison Policy Initiative California incarceration profile.
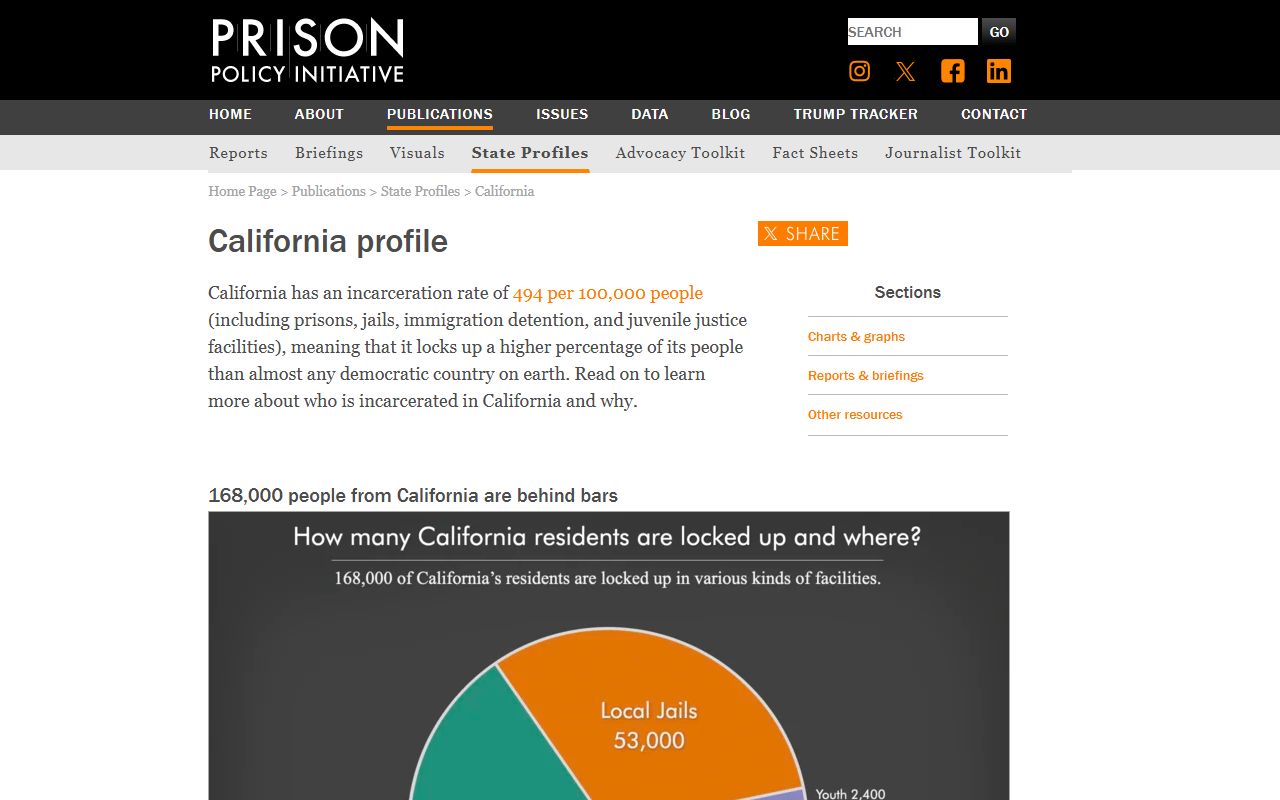
The Vera Institute publishes county-by-county jail trend data at incarcerationtrends.vera.org. The table below compares jail population rates per 100,000 across Riverside County, the state, and the nation.
| Level | Jail Population per 100k | Source |
|---|---|---|
| Riverside County | Local rate not currently published in indexed sources | Sheriff annual reports / BSCC |
| California | About 170 per 100,000 in recent BJS reports | BJS / Prison Policy Initiative |
| National | About 200 per 100,000 in recent BJS reports | BJS |
Population Trends Over Time
Riverside County jail population has tracked broader California trends. The 2011 realignment under AB 109 raised county jail populations across the state. The 2014 voter-approved Proposition 47 reduced certain drug and theft offenses to misdemeanors. That dropped some jail bookings. The 2016 Proposition 57 expanded parole and credit-earning for some state inmates. The county system also runs alternative custody tracks at Larry D. Smith. Long-run trends should be read against the county's growth to about 2.4 million residents across more than 7,300 square miles.
Searching Riverside County Inmate Records by Name
Riverside County inmate population data is an aggregate view. For an individual name lookup against the live jail roster, use Riverside County inmate records. JIMS is the right tool for booking-level questions, while population data is the right view for capacity, share, and rate questions.
Where the Data Comes From
Three sources feed the figures above. The Riverside County Sheriff's Office is the operator and primary data owner for jail capacity, ADP, and program counts. Sheriff data is posted across Corrections Operations, the public safety review document, and the correctional facilities summary page. BSCC sets the rated capacity counts used here.
BJS provides national context, including the annual jail census, jail inmate reports, and incarceration rate per 100,000. Vera Institute layers county-level trend data on top. Prison Policy Initiative aggregates state-level data for California. The U.S. Census Bureau supplies the population denominator used to convert raw counts into rates.